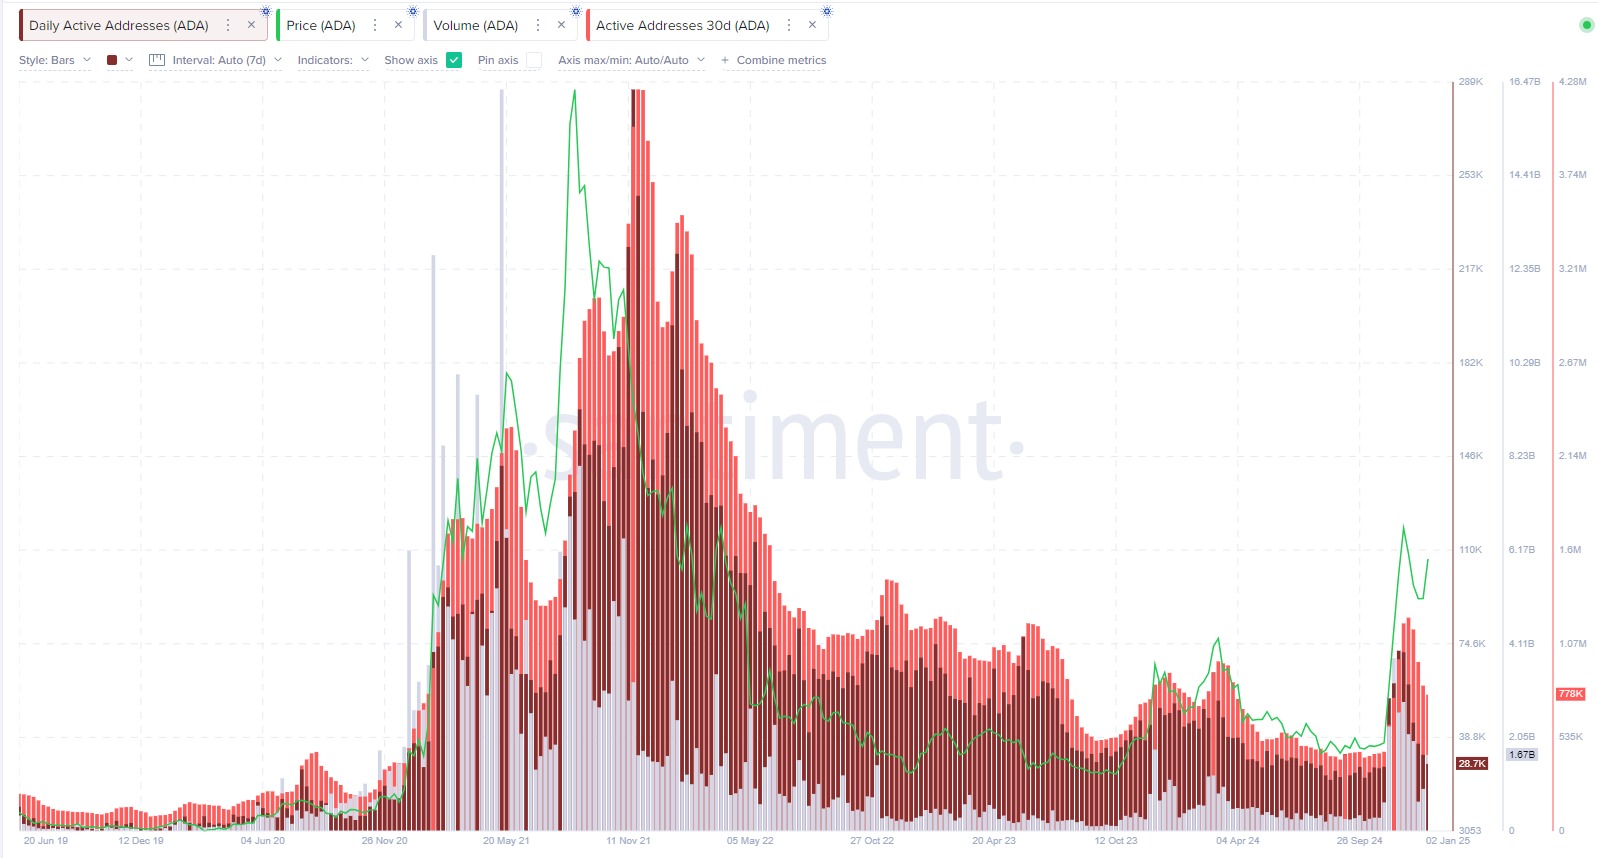
Cardano is up by over 10.75% in the last 24 hours, currently sitting at $1.0481 after crossing the $1 mark. This latest price action begs the question of whether Cardano’s 2021 historic bull run can be replicated.
Trading volumes for Cardano (ADA) are up by 23% to $1.62 billion, marking a renewed interest in the cryptocurrency. Crossing the $1 mark represents a psychological milestone for ADA after months of trading below this threshold.
Why is Cardano’s price rallying?
The recent jump in the market price of the token is probably due to both the new upgrades to blockchain technology and an increase in general optimism in the market. The blockchain also released its CIP-113 proposal on Jan. 2, which will allow for programmable assets, improved security, and smart accounts. Hoskinson, the founder of Cardano, has stated that the blockchain is growing into a multi-chain, multi-actor network scheduled with Midnight update.
It prepares for the tokenization of Real World Asset by the beginning of 2025, which is a basic aspect for further expansion of blockchain technology. Further Cardano has officially entered into its Voltaire era, a critical step towards decentralized governance. Additions such as Mithril are also going to enhance the node performance for the Cardano blockchain.
One such innovation is the optimization of the efficiency of DApps through incomplete transaction processing. It expands the user base through this ability to process partial transactions. With increasing trading activities and overall market recovery, ADA keeps on going north.
Cardano imitates 2021 bull run
Cardano’s recent rally has drawn comparisons to its 2021 bull run, with on-chain metrics showing a rise in daily and 30-day active addresses, a trend reminiscent of its historic price surge. On-chain metrics and historical data provide interesting comparisons. The chart shows that the number of active daily and 30-day addresses of ADA has increased multi-fold, a pattern similar to what was witnessed during the 2021 price explosion. At that time, high network activity coincided with ADA’s surge past $3 as people hoped for the Alonzo upgrade.

Activity levels, while not yet close to the highs reached in 2021, are trending upwards on support for the price breakout above $1. While on-chain metrics give hints of a possible repeat of the 2021 bull run, the progress made by ADA in reclaiming its previous highs will still depend on ongoing ADA adoption and broader market conditions. For now, all eyes are on ADA as it makes its way through this critical phase.


